Tutorial: Working with ArcExplorer™ 2
ArcExplorer™ is a GIS data viewer developed by ESRI. This freely available software offers an easy way to perform basic GIS functions. ArcExplorer™ is used for a variety of display, query, and data retrieval applications and supports a wide variety of standard data sources. ArcExplorer™ is intended for visualizing and exploring geographic datasets including related information (attributes of geographic entities). It allows the user to change the visualization of a map, to modify the scale, to zoom and pan, to manipulate what information layers are visible and their rendering, etc. It also allows you to print or export an image of a composed map.
For information about ArcExplorer™ please consult the following sources:
ArcExplorer™ Home Page: http://www.esri.com/software/arcexplorer/
ArcExplorer™ Forum: http://forums.esri.com/forums.asp?c=24
User's Manual in Adobe PDF format
This tutorial highlights some of the most basic operations associated to ArcExplorer™ 2 in the context of exploring the World Database on Protected Areas
Operations include:
- Getting Started
- Zoom, Modify Scale, and Pan the map's extent
- Identify a Protected Area (PA)
- Query spatial and attribute data (ie. getting database information)
- Measure distances on your map
- Create one symbol, unique symbols, and graduated symbols map
- Label map features with many options for effects
- ArcExplorer™ also features overview maps, saving a project, printing a map, and saving map to JPEG
- If you have other questions about ArcExplorer™ and have Internet access click here:
arcexplorer.pdf
I) Getting Started:
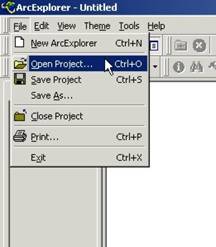
To Open Project:
A Project is a file that links to the various layers that make up a map. It is not the data itself. The term layer refers to a theme that is projected onto a map in ArcExplorer™, such as National PAs or Countries. Each layer can be activated or deactivated by clicking the small box next to it in the legend to the left of the map. Within the legend, the layers are stacked up on top of one another. The layer at the bottom of the list is on the bottom and the top is on the top. When opening a project, each layer that has been saved with that project file will be opened.
|
For faster presentation, it is recommended that you download the data onto your computer. When doing so, keep all files in the order they appear on the CD. When opening a project, ArcExplorer™ will look for the layers where the project referenced them. If they have been moved, it will warn you with a message that the data cannot be found. |
Projects can be opened in ArcExplorer™ by clicking on the 'File' pull down menu and then select 'Open Project' to navigate to project file.
II) Zoom, Modify Scale, and Pan the map's extent.
Zoom will change the scale of the map. You can focus in on a small region, the world map, and any scale in between.
To Zoom In/Out:
- Click on one of the two Magnifying Glass buttons on the Toolbar;
 to zoom in;
 to zoom out.
- Right Click in the corner of an area you want to see clearer and hold the button until a box in made around your area.
- At this point the map will redraw the selected area.
Zoom to Full Extent allows you to zoom out all the way to see the world map. Full extend is the scale that this project first opens up in.
To Zoom to Full Extent:
- Click the Zoom to Full Extent button
 on the Toolbar.
 - The map will redraw itself.
Modify Scale. As you zoom in and zoom out you are modifying the map's scale. Scale is a ratio of distance on the map to actual ground distance the map represents. The scale bar shows up on the bottom right edge of the window beneath the map.
Setting scale bar properties:
- Click the View menu and click Scale Bar Properties.
- Point to Map Units, Scale Units, and Screen Units to set the appropriate units.
|
Map units: Map units are the units in which geographic data is stored (data source units). You can set the map units as decimal degrees, feet, or meters. Scale units: Scale units display in the scale bar itself and in the right side of the verbal scale equation (1 centimeter = 200 kilometers). You can set the scale units as miles, feet, meters, or kilometers. Screen units: Screen units correspond to the actual display on your computer monitor and are presented on the left side of the verbal scale equation (e.g., 1 inch = 40 miles). You can set the screen units as either inches or centimeters. |
Pan allows you to move and re-center the map to a particular location. This is helpful when you have zoomed in to a region and would also like to see the surrounding areas at a larger scale.
To Pan:
- Click the Hand button
 on the Toolbar.
 - Click on the map image and drag in any direction to re-center the map on a different location.
III) Identify a Protected Area (PA)
The Identify tool allows you to see all the attribute information associated to a particular protected area point/ polygon, city, and/or road in the map. Attribute information refers to all the fields and records in the database for example: name of the protected area, category, designation, codes, etc.
To identify a map object:
- Click a layer in the legend to make it active i.e. protected area, road or city.
- Click the Identify button
 on the Toolbar.
 -
Click a feature on the map.
For example, if you clicked on the National PAs Polygon (IUCNCAT) in the legend, then click on a polygon on the map. - The results of the Identify are shown in the Identify Results dialog.
- If more than one feature is found, the features are listed in the Features panel. Click each feature to see its Identify results.
- Close the dialog box when done viewing results.
IV) Query spatial and attribute data.
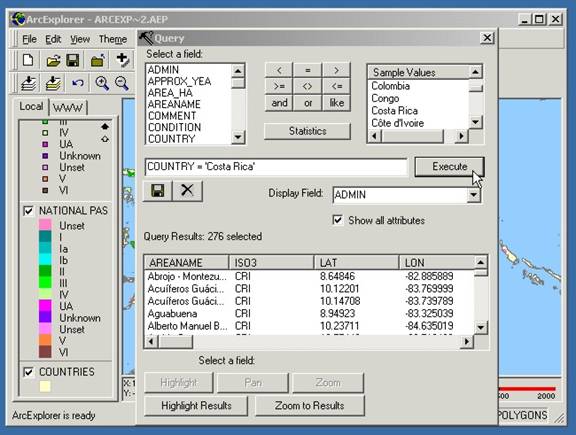
A query expression is a precise definition of what you want to select. This is a step forward from the Identify tool (mentioned above in Section III). As opposed to choosing only one Protected Area, it is possible to choose all the Protected Areas in a country or number of countries. You can also choose Protected Areas based on certain attributes in fields you are interested in.
How to build a query expression:
- Click a layer in the legend to make it active.
- Click the Query Builder button
 .
. - Click a field to query i.e. IUCN category, country, area, designation, marine, etc.
-
Click an operator to be used in the expression.
Using AND between expressions makes results more selective.
To select PAs in a country with a certain IUCN designation this will work:COUNTRY = 'United States' AND IUCNCAT = 'III',
because it will find PAs with both attributes. But it will not work with 'OR'.Using OR between expressions makes results less selective.
To select each PA from several countries this will work:Country = 'Argentina' OR Country = 'Chile',
because it will look for results having either/or attribute. But this will not work with 'AND'.
- Click a sample value or type a value for the expression.
- Verify that the query expression is correct.
- Choose the Display Field you want to display. If you would like to see all the data check the box next to 'Show All Attributes'.
- Click 'Execute' to perform the query. The results appear in the lower panel.
Further Options:
- Select a field i.e. country, area, IUCN category etc, and click 'Highlight' to make the selected feature or features highlighted on the map.
- Select the field you want and click 'Pan or Zoom' to move the image or to zoom into the selected features.
- Click Statistics and then choose a field to know more detailed information on the protected areas layer.
- Click a field to be used for statistics i.e. size, IUCN category, etc and click 'OK.' The statistics are shown in a separate dialog.
-
Click the 'Save' button to save the query results to a text file in your hard drive.
The results of a query can be saved to a pipe-delimited (|) text file. The text file can then be used in another program, such as Microsoft Excel or Microsoft Access, to create a spreadsheet.
V) Measure distances
You can measure distances on your map in feet (ft), miles (mi), meters (m), or kilometers (km). You can also use the scale bar (mentioned above in Section II) to measure distance.
How to measure a distance:
- Select the measurement units to the right of the Measure button

- Click the measure button.
- Click and drag a line defining the distance you would like to measure. The segment and total measures appear your selected units in the upper left corner of the map.
-
To clear the measure totals and end measuring, double click on the map.
If the measure results seem incorrect, verify that the map units are set appropriately. You can set the map units by clicking the View menu, clicking Scale Bar Properties, pointing to Map Units, and clicking the appropriate unit.
VI) Create one symbol, unique symbols, and graduated symbols map.
Changing symbols is helpful when looking for spatial patterns based on certain attributes, such as comparing Protected Areas by designation type, year created. Etc.
Displays all the features in a layer with the same color and style. When you add a layer to ArcExplorer™, it is displayed as One Symbol maps. Using the Theme Properties dialog, you can change the color, size, or style of the One Symbol map.
How to draw features with one symbol:
- Click a layer in the legend to make it active.
- Click the Theme Properties button

- Click the Style box to apply a new style to the layer.
- Click the Color box to choose a color.
- Click the Size box to apply a new size to the layer.
- Click OK to close the dialog box and see the changes.
Displays a layer summary by applying a different range of colors to each unique value in a specific field i.e, if a 'unique symbol' is applied to the 'IUCN category' field in the protected area data layer, it will differentiate all the protected areas by using different colors for each IUCN category.
How to make a Unique Symbols map:
- Click a layer in the legend to make it active.
- Click the Theme Properties button
- Click Unique Symbols.
- Click a Field you want to differentiate.
- Click a Color Scheme or click the color of the symbol itself and change it that way.
- Click a Style.
- Check Remove Outline to remove the outline on features.
- Click an entry in the Symbol column to change its color.
- Double-click an entry in the Label column to select it. Enter a new label value.
- Click OK to close the dialog box and see the changes.
Using the Graduated Symbols classification, the range of attribute values is divided into equal-sized subranges; the features are then classified based on those sub-ranges.
How to make a Graduated Symbols map:
- Click a layer in the legend to make it active.
- Click the Theme Properties button .
- Click Graduated Symbols.
- Click a Field.
- Click a number of Classes.
- Click a Style.
- Click a Start and End Color.
- Click a Start and End Size.
- Click an entry in the Symbol column to change its color.
- Double-click an entry in the Label column to select it. Enter a new label value.
- Click OK to close the dialog box and see the changes.
VII) Label map features with many options for effects.
Add labels to features with the Labels tab of the Theme Properties dialog box.
To create a Label Map:
- Click the Theme Properties button .
- Choose either Standard Labels OR No Overlapping Labels.
- Choose a Text field.
- Choose other preferences.
- Click OK to commit the changes and close the Theme Properties dialog.
VIII) ArcExplorer™ also features overview maps, saving a project, printing a map, and saving map to JPEG.
An Overview map is another tool that allows you to pan (mentioned in Section II above) across the map. This allows you to see a small version of the full extent in the bottom right hand corner and a red box delineates your current view (the big map on the screen). The red box can be dragged across the full extent to pan to another area.
Opening an overview map
Click the View menu and check Overview Map to add an overview map panel.
Adding a layer to the overview map
- Choose a theme to display in the overview map. Typically, a theme showing boundaries or the extent of your study area, such as world country boundaries, is used in the overview map.
- Make the theme active and choose Use in Overview from the Theme menu. Only one theme can appear in the overview at a time.
-
Now click and drag the red box inside the overview map to pan the map view.
Zooming in very close to a feature will result in a zoomed in map that may not have a red outline.
- Click the Save Project button
 on the Toolbar.
 - Navigate to a folder.
- Type a name for the project.
- Click Save.
- Click the Print button.
- If necessary, change the printer settings.
- Click OK.
How to save a map to a file (JPEG):
- Click the Copy Map Image to File button
 on the Toolbar.
 - Navigate to a folder.
- Type a name for the image.
- Click Save. A JPEG of your map has been saved to the selected folder.
Questions?
How do I access the database?
Go to the Query Builder
This will allow you to search the records by country, designate, or any other field in the table. The data you retrieve is savable as a Pipe-Delineated file (|) that can be opened in Excel or other spreadsheet viewer.
Can I select a Protected Area and find out information about it?
Yes, see Identify a Protected Area (PA)
How do I print a map?
There are two options for this:
- see How to Print
- see How to copy a map to a file (JPEG); once in this format you can no longer change anything within the map, but it is easy to print out or send to someone else.